Yesterday I took part in an event at Roosevelt sponsored by its Office of Institutional Research, Assessment, and Reaccreditation on academic program assessment. Faculty and staff from over a dozen academic departments across the six colleges of the university presented data and conclusions from the 2013-14 academic assessment work that was supported by a “microgrant” program for the Spring 2014 semester.
I gave a short presentation (see this pdf of the slideshow) on the assessment work we did in the Sustainability Studies Program in 2013-14: the Sustainability Literacy Survey that was administered to all Fall 2013 SUST classes as well as to a sub-sample of other CPS undergraduate courses in Criminal Justice and Professional & Liberal Studies gen ed seminars.
This preliminary survey was a key part of the SUST Program’s Assessment Plan for 2013-14, and was based on the “Assessment of Sustainability Knowledge” survey instrument developed in July 2013 by The Environmental & Social Sustainability Lab, The Ohio State University. This survey was endorsed as assessment tool by AASHE and has been promoted on the AASHE blog to other universities wishing to gather comparable data about the general level of sustainability literacy among US undergraduates.
Goals of the Sustainability Literacy (SL) Survey
- Determine baseline SL of RU undergrads in 2013
- Compare groups of students (by class, age, major, etc.)
- Facilitate program assessment in relation to SL at other US universities
- Provide one means of assessing the current SUST curriculum
Results
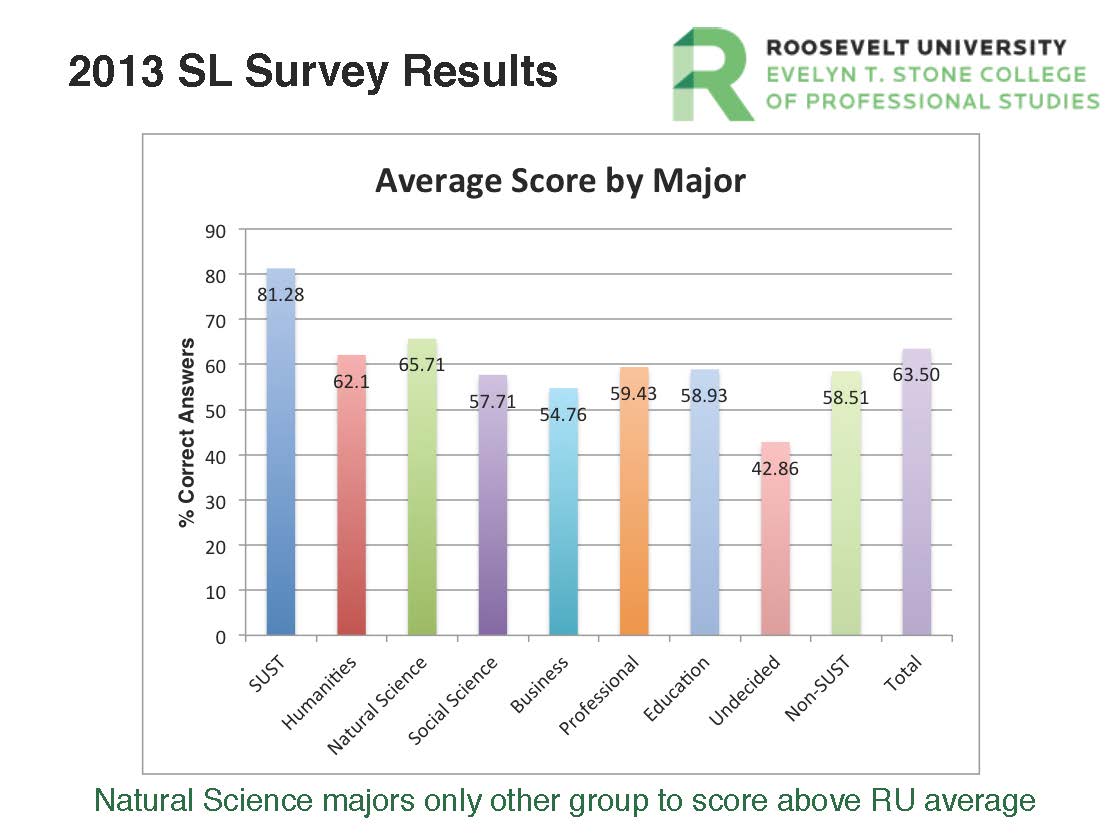
Despite the rather small sample size (173 surveys will returned) of this pilot study, some useful data resulted from the effort. The graph below displays how different majors performed on the survey in terms of overall % of correct answers out of 28 questions that covered environmental, economic, and social topics related to sustainability. SUST majors outperformed all other groups by a wide margin here.
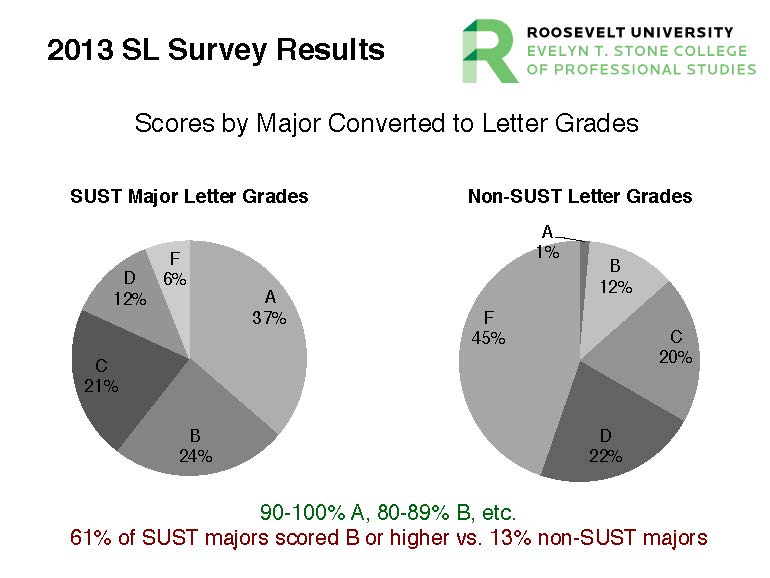
Another useful way to view the data is to convert the % correct scores of each respondent to a letter grade, using the traditional scale of 90% = A, etc. This provides a more nuanced look at how students in different groups do on the assessment beyond the mean score. Notably, almost two-thirds of SUST majors scored a B or higher on the survey, while only 6% failed. In contrast, 87% of non-SUST majors scored a C or lower on the survey.
 Conclusions
- Sustainability Studies majors as a group score significantly higher on this sustainability literacy survey than non-SUST students at RU as a whole, or any other sub-group of undergraduate majors.
- RU students as a whole score slightly lower than undergrads at the Ohio State University (64% vs. 69%, respectively), but their performance is comparable.
- Overall, undergraduate students at RU are relatively illiterate about basic sustainability facts and issues, as their average score is a “D” when converted to a letter grade.
- SUST majors scores potentially indicate the value of the curriculum at improving basic sustainability literacy at the undergraduate level, though some such students may enter RU with a higher baseline level of SL.
- There is a real need for sustainability education across the board for all undergraduate students, regardless of major.
Next Steps for SUST Program Assessment
- Continue analyzing results of SL Survey and share with SUST part-time faculty.
- Explore feasibility of administering the student to a representative sample of all RU undergrads in 2014-15.
- Contribute assessment data to RU’s Environmental Sustainability Committee and discuss relevance STARS 2.0 reporting for overall university sustainability efforts.
- Follow up with other assessment activities: curriculum review, alumni survey, writing/communication/critical analysis skills, etc.
Special Acknowledgment: The “Rogers Factor”
Key contributions to this survey assessment and analysis were made by two invaluable people at RU, who together constitute the “Rogers Factor”:
Ester Rogers, RU’s Office of Institutional Research: helped with survey design & implementation, suggestions for modes of analysis, and Microgrant funding support during the Spring 2014 semester.
Scott Rogers, junior SUST major in the College of Professional Studies: performed key data entry work and contributed a wide range of preliminary analysis of survey results.
Resources on Sustainability Assessment
- Sustainability Studies Assessment Plan (pdf), updated Jan. 2014
- Ohio State University’s Environmental and Social Sustainability Lab, Measuring Undergraduate Students’ Knowledge of Sustainability (July 2013)
- Monika Urbanski, “Assessing Sustainability Literacy: Challenges, Current Research, and Opportunities for Collaboration” (AASHE blog 5 Nov 2012); How Many Dots To Connect? Defining Sustainability in the Curriculum (18 Feb 2013)
- Environmental Literacy Council
- AASHE blog posts on curriculum
- NSSE Sustainability Education Consortium: A First Year Report (2011)